


| Measure | Value and condition | Planning use |
|---|---|---|
| North American average, 2024 | $11.31, up from $9.16 in 2019 | Budget a standard ticket near this level rather than from older figures. |
| Latest quarter, Q4 2024 | Record $11.64 | Shows where pricing was heading at the end of the year, not what a typical full-year ticket cost. |
| Average in 1995 | $4.35 nominal; $8.43 in 2022 dollars | Compare decades in real terms, never in raw dollars. |
| Average in 2022 | $9.17, with 0.828 billion tickets sold | Shows that price and attendance can move apart. |
| Average in 2016 | $8.65, with 1.3 billion tickets sold | Shows far more tickets sold at a lower price than in 2022. |
Figures come from WorldAtlas, citing industry data compiled by The Numbers, and from Giggster’s inflation-adjusted ticket series.
The average movie ticket price in North America was $11.31 in 2024. Treat it as a baseline across ticket sales, not a quote for an IMAX, 3D or recliner seat.
For wider context on grosses and releases, follow our movie news coverage. If you are deciding when to buy, check the upcoming movies release dates first, because the price you face depends on the film and the screen you pick.
Planning around the average ticket price
The average is most useful as a ceiling on surprise, not as a price tag. The North American average reached $11.31 in 2024, and the fourth quarter of that year set a record of $11.64. A family or group that budgets from an older figure will underestimate the bill. These are the practical decisions that follow from the numbers.

- Budget from the newest figure. Use the 2024 average as the starting point for a standard showing, and expect the quarterly record to be a better guide to current pricing than a figure from several years back.
- Compare years in real dollars. A ticket from decades ago looks very cheap in nominal terms, but adjusting for inflation closes much of the gap. The inflation section below explains how far.
- Price the format, not the film. The same title can be sold in several formats and seat types. Compare the listed price for your chosen screening with the average before deciding whether the upgrade is worth it.
- Read grosses with price in mind. A bigger opening-weekend number can come from more people, from higher prices, or from both. The box office section below shows why the two should not be confused.
That last point matters most when a premium screen is involved, because the format a viewer chooses is where the average stops describing the real cost.
Premium formats, 3D and recliner seating
Premium large format screens, 3D showings and recliner auditoriums are different products from a standard seat. The averages in this guide describe ticket sales broadly. They are not a price list for any one auditorium, so the listing for your chosen showing is the only reliable price.
A sensible rule is to pay for a premium experience when the film is built around it and to stay with a standard screen when it is not. Spectacle-driven releases give a bigger screen or immersive sound the most to do. Dialogue-driven films lose less when shown in a standard room.
IMAX and other premium large format screens
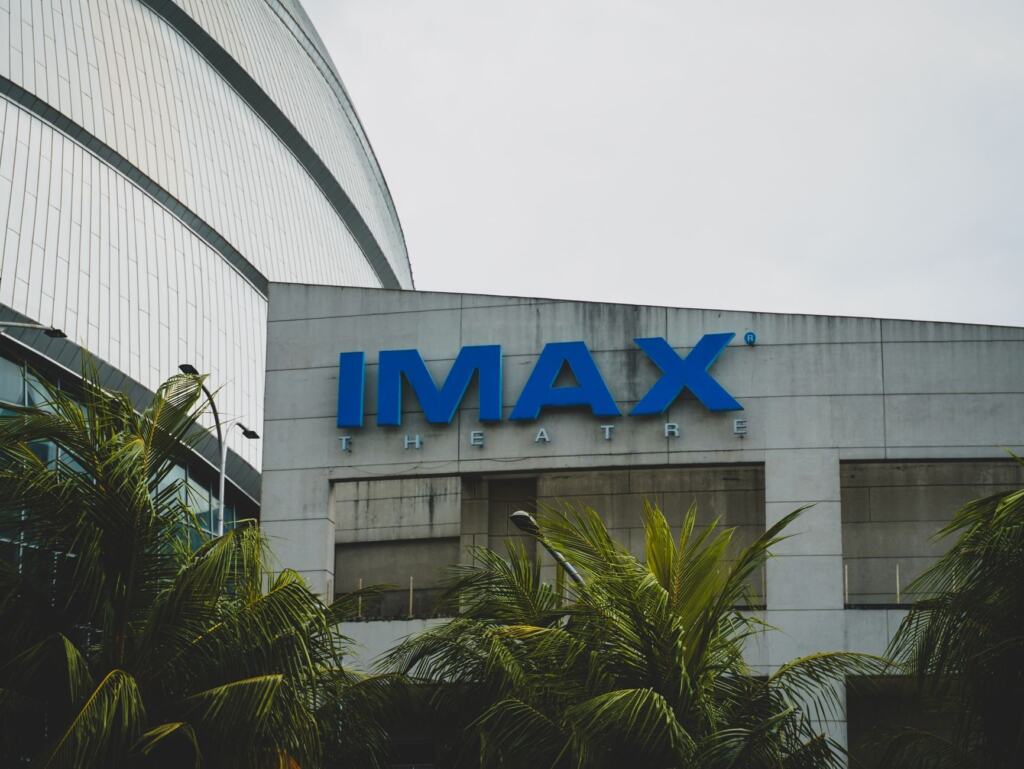
IMAX is the best-known premium large format brand, and IMAX box office share is a statistic that is easy to misread. If a format charges more per seat, its share of ticket revenue can run ahead of its share of attendance. A high revenue share therefore tells you about dollars, not necessarily about how many people chose the screen. When you see such a share quoted, ask whether it counts tickets or revenue before drawing conclusions.
3D showings
The question behind 3D versus 2D box office share is the same one that applies to any premium format. A 3D showing is a separate ticket with its own listed price, so its slice of a film’s gross reflects both how many people chose it and what they paid. For a buyer, the choice is simple. Pick 3D when the film was made to use it and you enjoy the effect, and pick the standard version when the extra cost buys you little.
Recliner seating
Recliner auditoriums change the seat, not the picture. They suit long films and viewers who value space more than screen size. A premium seat and a premium screen are separate purchases, so check which one a listing actually includes before comparing prices.

How much of the price rise is inflation
Inflation explains much of the nominal climb in ticket prices, and the evidence is clearest when older averages are restated in 2022 dollars. Giggster’s inflation-adjusted series puts the 1995 average of $4.35 at $8.43 in 2022 dollars. The 2000 average of $5.39 becomes $9.24, the 2010 average of $7.89 becomes $10.70, and the 2015 average of $8.43 becomes $10.48.
Read in real terms, the line is much flatter than the raw numbers suggest. Between 1995 and 2015 the adjusted figure moves from $8.43 to $10.48, far less dramatic than a jump from $4.35 to $8.43 would imply if inflation were ignored.
The recent period points the same way. WorldAtlas reports that the North American average rose in line with consumer-price inflation from 2017 to 2024. The practical lesson is to stop treating each new high as a sign of unusual pricing. A new nominal record is expected when general prices rise, and the better test is whether tickets have become expensive relative to the rest of the household budget.
Do higher prices mean higher box office totals
No. A higher average price does not by itself produce a bigger box office total, because gross revenue also depends on how many tickets are sold. Giggster’s data shows 1.3 billion tickets sold in 2016 at an average of $8.65. In 2022 the average was higher at $9.17, yet only 0.828 billion tickets were sold.

That contrast is why headline grosses need a second look. When a film or a year is reported as a record, ask whether the audience grew or the ticket got dearer. A gross that rises because of price tells you less about audience demand than one that rises with attendance. Lower attendance at a higher price can leave the total looking healthier than the audience really is.
Attendance is also what studios work hardest to build before release. The best movie marketing campaigns are aimed at getting people into seats, which is why price and audience size are worth reading separately.
Where each ticket dollar goes
A ticket price is split among several parties, and the theater does not keep all of it. A CreativeFuture breakdown says 50% of each ticket goes back to the filmmakers, and about 20% of each ticket pays the theater’s rent and bills.
Two implications follow. First, a higher ticket price is not pure gain for the exhibitor, because a large portion covers the film itself and a further portion covers keeping the building running. Second, those figures come from one outlet’s illustration, so treat them as a guide to the shape of the split rather than a contract term for a specific film.
Who reports ticket-price data
The National Association of Theatre Owners is the exhibition industry body whose name appears alongside box office statistics. According to WorldAtlas, it rebranded as Cinema United in March 2025. Anyone looking for newer industry commentary should search under both names, because older reports and newer ones may use different labels.
Whatever the source, check three things before relying on a figure: the year, whether the price is nominal or inflation-adjusted, and whether the number covers all showings or a particular format. Mixing those up is the most common way an average ticket price ends up misleading.
Frequently asked questions
How old is the $8.00 US average that still appears online?
A CreativeFuture article dated 01-09-17 put the US average at $8.00. It predates the 2024 figures, so do not compare it directly with the later average.
What does the record Q4 2024 figure mean?
The $11.64 recorded for Q4 2024 is the highest quarterly average reported. It is a single quarter, so it is a pointer to current pricing and not a full-year average.
Do I need inflation-adjusted prices to compare 2010 with 2022?
Yes. In Giggster’s series, the 2010 average of $7.89 equals $10.70 in 2022 dollars, which is above the $9.17 actual average for 2022. In real terms, a 2010 ticket cost more than a 2022 one.